Building Habits, with a lot of help from Github
April 19, 2016 • programming
I suck at habits. I start out a dozen different things every week, and I drop them as easily soon after. I needed to do something about it. I have used any.do (irritating), keep, inbox reminders, and many other lists. Nothing works for me.
What?
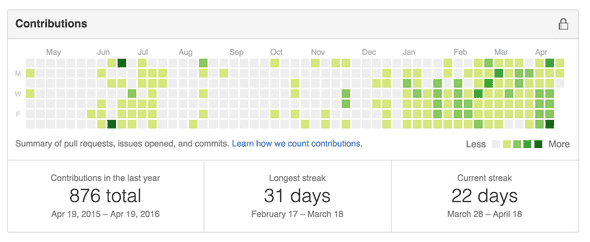
I thought I needed something to keep me motivated. Now there is somebody who I know does it best. Github. Yooo, it has that green graph on your profile that sits there proudly, a badge pronouncing your commitment to code.
And the streak thing? I know that stuff has made me write code and push, sometimes meaningless commits (sometimes just adding a comment on any of my files directly on github from my phone because I was afk), just to not lose that streak. There is something about those green squares that gives me minor OCD. I decided I need that for my habits.
So, what’s the plan?
I didn’t want to make a website for it as I wanted it to work offline as well. Plus building websites is so 2015, right? I was yearning for trying out something new and so decided to give electron a go! It looked fun. Roped in Arpit, because doing it in a team makes everything fun.
We were going to ask the user about the habits he needed to track, and done. You could +1 a habit after you do it and we update your chart. Sweet. No.
How do we track different habits on the same chart, do we make separate charts for each habit? No that is so messy. We somehow had to show all the information in that one square. Then there was the problem about the importance in habits. Some habits (like “drink a glass of water”) are not as important as some others (like “exercise for 10 minutes”). But if you mark +1 for “water” 10 times a day, you get a darker shade of green. Nobody gets to know that you didn’t do exercise, nobody except your conscience (and if only we listened to our conscience we would all have abs). I didn’t want people to cheat like I did with Github, and I wanted them to know when they weren’t doing good on the chart.
So we decided to have two groups of habits:
- habits that are good to do
- habits that are bad not to do
So when you skip a habit from the second group, a red gradient gets added to your overall color, and your final color is no more a shade of green. It has a redness to it, and now it stands out in your chart. Of course you don’t want it there right? Then move your ass!
Where are you now?
Well, we started this a month back, and then lost momentum (I got busy doing other awesome stuff at Squad. Me and Arpit together have a Mac and a Linux machine between us, so this hasn’t been tested on Windows.
We would love to have somebody finish what we started. Here is the repository: ketanbhatt/habits
What has been done:
- Adding habits using a form, persist in the database and displaying them
- Displaying a heatmap
- Making the ”+” Button to commit a habit
- Making a menu icon for the app
What remains:
- Updating heatmap when ”+” is pressed
- That redness thing for habits you must follow
- UI touchup
Libraries we used:
- Electron, of course
- NeDB, an in-memory database
- Cal-heatmap, how we drew the heatmap
